Investing in so-called “hard money” loans is an excellent way to achieve significant income if it’s done in a way that controls risk. In a couple of earlier posts which you can read here and here, I discussed reasons why I’m investing in loans through crowdfunding platforms like Patch of Land and PeerStreet, and four criteria I look for in every loan. With this post, I’ll explain how I perform more detailed due diligence on loans that meet those four criteria.
The goal here is to verify that the underlying property is really worth as much as the crowdfunding platform claims. If it’s not, then the property can’t be sold for enough money to repay my investment. I look for a “loan-to’value” ratio (LTV) of at least 75%, meaning the loan amount is 75% (or less) of the market value of the underlying property. That way there’s a 25% cushion if the borrower defaults, meaning it should be possible to foreclose and sell the property for 25% more than the loan amount. Of course there are fees and holding costs associated with foreclosures, so in the real world I’d do well to get all of my investment back after those costs, but with a 75% LTV I have a fighting chance of breaking even or maybe even showing a small profit. That’s not a bad worst case scenario in today’s investing climate.
Patch of Land and PeerStreet both state the underlying property’s value when they post a deal on their platforms, and those valuations are done by professional appraisers or real estate brokers. I still go to the trouble of double checking the property value anyway, and on several occasions I’ve determined that their stated property values were too high. I don’t believe Patch of Land or PeerStreet would overstate a value deliberately. On the contrary, I think they’re both ethical companies, or I wouldn’t invest with them. Rather, real estate valuation is an inexact process due to the influence of numerous intangible factors. Therefore, just as I would never invest in common stock based solely on the information in a company’s own shareholder’s report, so I would never invest in a crowdfunding platform’s loan without looking outside of the platform’s data to confirm the investment’s value.
Here’s how I do it:
The goal is to compare the underlying property’s valuation to the sold prices of comparable recently sold properties in the immediate area. We want to make sure the average price of the most similar “sold comps” at least equals the crowdfunding platform’s valuation. For most properties, the information on sold comps is available online at websites like Realtor.com, Zillow, or Redfin. If you can’t find the underlying property on those sites, or if you can’t find recently sold comps in the immediate area of the underlying property, you should probably not make the loan.
Realtor.com and Zillow cover the entire USA as far as I can tell, while Redfin’s coverage area is more limited. But I prefer to use Redfin whenever possible, because in most of its covered cities it provides sold comp information in a list format which can be downloaded as a spreadsheet for more detailed analysis. So to follow along as I demonstrate the process, step one is to open Redfin.com.
If you clicked the Redfin link you should have their home page open in a new window. In this example, we will assume the underlying property address is 2926 Searchwood Dr., Jacksonville, FL 32277. Copy and paste that address into the search bar on Redfin’s home page and press your enter key.
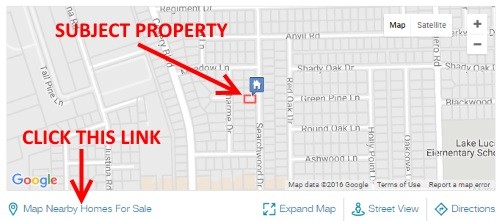
You should now be looking at Redfin’s page for the house at that address. Scroll down until you see a map with the house indicated by a blue icon. Below the map click the “Map Nearby Homes For Sale” link. Click the link.

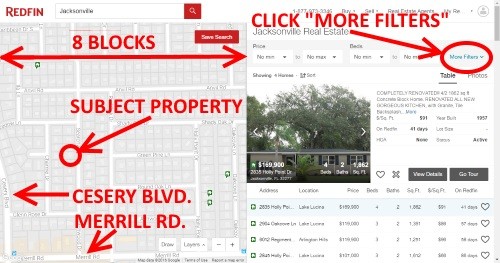
A new page will open which displays another map showing actively listed properties on the left, and a corresponding list of the same properties on the right. Let’s focus first on the map. The farther away a sold comp is located from the subject property the less valid it is, so zoom in on the map until it displays an area about six to eight blocks wide around the subject property. In this case, just click the “+” box once.
It’s also important to avoid comps in different neighborhoods, so if the map shows a major road or highway, a river, or other natural boundary which might form a separation between the subject property’s neighborhood and a different neighborhood, we’ll need to move the map view around to ensure that it displays as little of the other neighborhood as possible. Do this by hovering your cursor over the map, “grab” the map with a double click (tap twice and hold after the second tap). Then move the map view until the intersection of Merrill Rd. and Cesery Blvd. is at the extreme lower left. Notice as you move the map the houses listed on the right may change. This should ensure that no properties on the wrong side of those two major roads will appear in your results.

Now that you have zeroed in on the immediate area of the subject property, and made sure not to include any areas which look like they could be considered a different neighborhood, it’s time to replace the active listings with sold listings. Do that by clicking on the “More Filters” link at the upper right above the list.
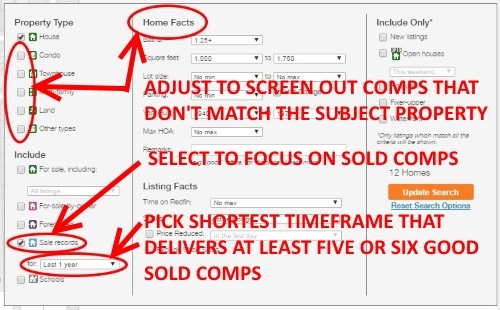
The advanced filters menu should now be displayed. In the left column deselect every Property Type except for “House.” Select “Sale Records.” Finally, go through the “Home Facts” options to narrow the search to a set of metrics which closely match the subject property. For example, in this case the house size is 1304 square feet, so I selected a minimum square feet of 1000 and a maximum of 1750. The subject property has three bedrooms and 1.5 baths so I selected those options as well. the house was built in 1950 so I selected 1940 to 1960 under “Year Built.” You get the idea.
Finally, next to the “Sale Records” button is a drop down menu that lets you select a date range for the sold comps. Select “last 3 months.” Click “Update Search” and check the map to see how many sold comps appear. If there are fewer than five or so, go back to “More Filters” and increase the sale records period to “last 6 months.” If there still aren’t enough comps, try “last 1 year.” Be sure to pick the briefest period possible to generate enough comps ,because the more recent a comp is, the more accurate the comp is.

When you’re ready, click the orange “Update Search” button. The “More Filters” menu goes away and you should be looking at the map and list again, except now the icons on the map are all blue, indicating sold properties. Scroll down to the bottom of the properties list on the right. Clink the “download all” link just below the list. This will download a Microsoft Excel file directly to your computer. It’s in a .csv file format which should work with most kinds of spreadsheet software. Find and open the file.
I would never invest in a crowdfunding platform’s loan without looking outside of the platform’s data to confirm the investment’s value.
Find the “URL” column and use the links below to open each property’s individual webpage. Review the photos and written information for each of them to compare their condition to the subject property. If the condition or amenities are substantially better or worse than the subject property, you’ll have to add or subtract dollars from that comp’s sold price to make it a better match. For example, the subject property has no swimming pool, so if one of the comps shows a pool, you should lower the sold price accordingly for that comp. But the subject property has clearly been remodeled inside and out, with new flooring, paint, roof, and so forth. If you find a comp that’s a total “fixer” you’ll need to either delete it, or add the value of a remodel to the sold price for that comp. To do that simply go to the “Price” column and make the adjustment. (If you don’t know how, click here for a basic Excel primer.) The amount you add or subtract will be somewhat subjective, because the market value of a swimming pool or a new roof will vary from market to market. You may need to do some research. In most markets you can find real estate agent blogs that discuss the going rate for such improvements.
Once you’ve reviewed all of the sold comps and made adjustments to the price to ensure that they’re “apples to apples” comparisons to the subject property, it’s time to calculate the market value. The formula for this is simple:
(Average Sold Price / Average Square Feet) x Subject Property Square Feet.
So you find the average of all the entries in the “Price” column, divide that by the average of all the property sizes in the “”SqFt” column, and multiply the result by the size in square feet of the subject property. That’s your valuation. (To learn how to use the “average” function in Excel, click here.)
Now divide the crowdfunding platform’s loan amount by your own valuation amount. If the result is a loan-to-value (LTV) of 75% or less, chances are that the crowdfunding site’s valuation of the underlying property is solid, and you may want to invest. (Although you should also factor in your own criteria, and the LTV is just one of many risk points to consider, as I have pointed out before.) If your LTV is more than 75%, you should consider the possibility that the crowdfunding site has overvalued the property, and if you trust your own valuation, you may not want to invest. I wouldn’t.
For more on this subject, click here and here.
I received no consideration of any kind from Peer Street, Patch of Land, or Redfin for this blog post.
See disclaimer at bottom of page.